gcsescience.com 17 gcsescience.com
Measuring Half-life from a Graph.
How can Half-life be Measured from a Graph?
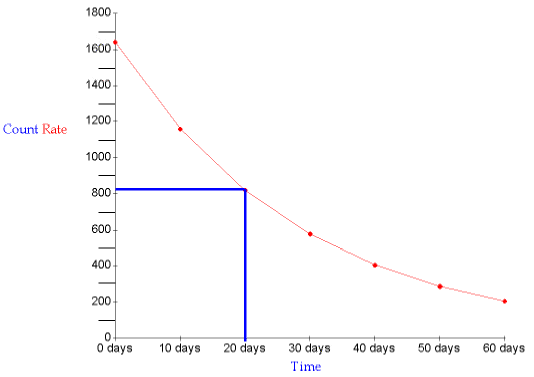
A graph showing how the count rate decreases as
time goes by
will have a curve like the one shown in the picture
below.
For any particular radioisotope the
count rate and time will
be
different but the shape of the curve will be the same.

The easiest way to measure the half-life from the graph is to
1. Read the original count
rate at zero
days.
On our graph the reading is 1640
counts.
2. Go down to half the original count rate
(820 counts)
and draw a horizontal line to the
curve.
Then draw a vertical line down from
the curve.
You can read off the half-life where
the line crosses the time
axis.

On our graph the half-life is 20 days.
![]() Links
Radioactivity
Half-life
Revision Questions
Links
Radioactivity
Half-life
Revision Questions
![]()
gcsescience.com Physics Quiz Index Radioactivity Quiz gcsescience.com
Home GCSE Chemistry GCSE Physics
Copyright © 2015 gcsescience.com. All Rights Reserved.